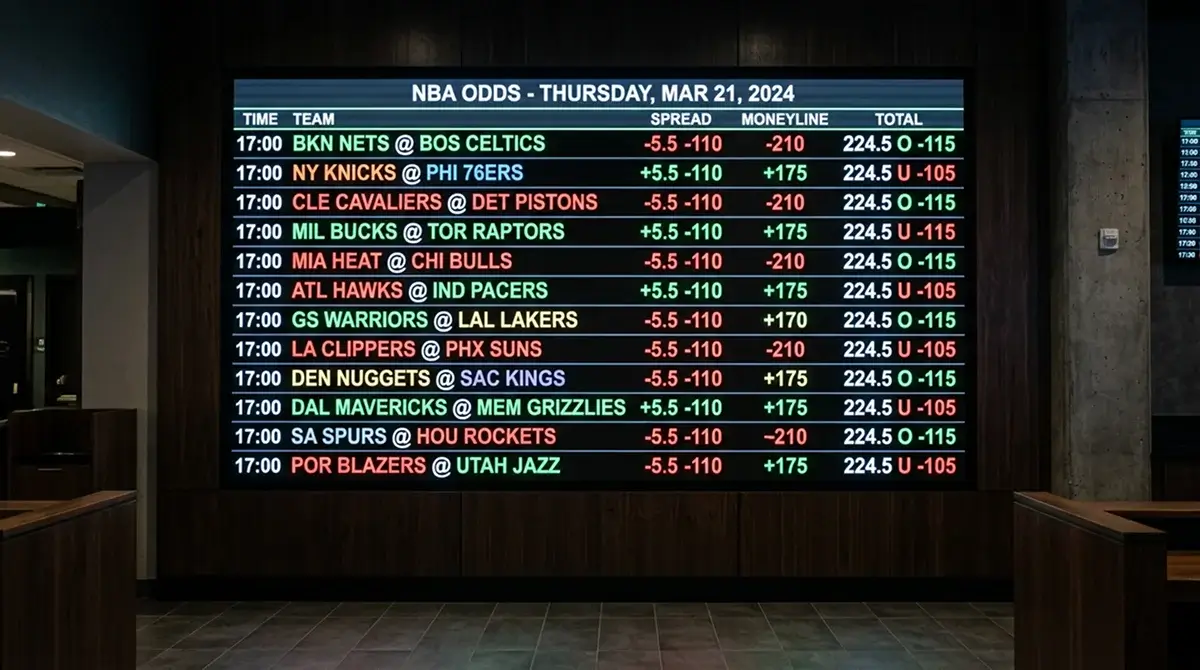
Totals Are Not Just Guesswork — Pace and Efficiency Tell the Story
 Available in US

Totals Are Not Just Guesswork — Pace and Efficiency Tell the Story
My first year of NBA totals betting was a disaster dressed up as a learning experience. I would look at two high-scoring teams, assume the game would be a shootout, and hammer the over. Sometimes it worked. More often, the bookmaker had already baked the obvious into the number, and I was paying 1.91 for zero edge. The turning point came when I started building totals projections from components rather than vibes — and the two components that matter most are pace and efficiency.
Basketball sits in the 15% to 18% range of global betting turnover, which makes NBA totals one of the most liquid and heavily modelled markets on any given night. The bookmaker’s number is not a casual estimate; it is the output of a sophisticated model. Beating that number requires your own model — or at least a systematic framework that catches what the bookmaker’s model misses.
Pace Explained: Possessions Per 48 Minutes
Pace is the engine that drives every game total. It measures how many possessions a team uses per 48 minutes. A team with a pace of 102 generates roughly 102 offensive opportunities per game. A team at 96 is six possessions slower. When two teams meet, the game’s pace lands somewhere between their individual paces — influenced by which team controls tempo and how the matchup unfolds.
Here is why pace matters more than raw scoring averages. A team that averages 115 points per game at a pace of 104 is scoring 1.106 points per possession. A team that averages 108 points at a pace of 96 is scoring 1.125 points per possession — actually more efficient despite the lower raw total. If these two teams play each other, the game pace will likely settle around 100 possessions. The higher-scoring team’s raw average is irrelevant; what matters is how many possessions occur and what each team does with them.
I estimate game pace by averaging the two teams’ individual pace figures and then adjusting for matchup context. If one team is elite at controlling tempo — slowing the game through half-court offence and disciplined defence — they typically pull the game pace closer to their number. The adjustment is not exact, but a weighted average that gives 60% weight to the slower team has produced more accurate projections than a straight average in my experience.
Combining ORTG and DRTG to Project Game Totals
Once you have a pace estimate, the next step is efficiency. Offensive Rating (ORTG) measures points scored per 100 possessions. Defensive Rating (DRTG) measures points allowed per 100 possessions. Every team in the NBA has both figures, and they update daily on free advanced-stats platforms.
The projection formula is straightforward. For each team, take their opponent’s DRTG and their own ORTG, average them, and multiply by the estimated possessions. This gives you each team’s projected score. Add them together for the game total.
A worked example: Team A has an ORTG of 114 and faces Team B’s DRTG of 110. The matchup-adjusted efficiency for Team A is (114 + 110) / 2 = 112 points per 100 possessions. If the estimated game pace is 100 possessions, Team A projects to score 112 points. Run the same calculation for Team B, add the two projections, and compare the sum to the bookmaker’s total. NBA viewership hit 170 million this season — a historic high — and all that attention means more data, more analysis, and sharper lines. Your projection needs to be precise to find value.
One nuance: recent form matters more than season-long averages for efficiency. A team’s ORTG over the last ten games is a better predictor of next-game efficiency than their full-season number, because it captures lineup changes, injuries, and tactical adjustments that the season-long average smooths out. I use a blended figure: 60% last-ten-game efficiency, 40% season-long. That blend has consistently outperformed either metric alone in my back-testing.
Situational Factors That Swing Totals: Pace Mismatches and Blowouts
The pace-and-efficiency model gives you a baseline, but the baseline needs situational adjustment. Three factors regularly push game totals away from the model’s projection.
First, pace mismatches. When the fastest team in the league meets the slowest, the projected pace — wherever it lands — carries wider uncertainty. The game could settle at the fast team’s tempo or the slow team’s tempo, and the scoring difference between those outcomes might be 15 points. I treat extreme pace mismatches as “pass” situations unless one team has a dominant track record of imposing their tempo regardless of opponent. Uncertainty is not the same as opportunity.
Second, blowout risk. A game between a title contender and a rebuilding team has a high probability of becoming a blowout. Blowouts compress the total because the leading team pulls starters in the fourth quarter and the trailing team stops competing. My model adds a blowout discount of roughly two points to the total when the spread exceeds 10 points — a small adjustment that captures the fourth-quarter scoring decline.
Third, back-to-back fatigue. Tired teams play worse defence, which pushes the total up — but they also score less efficiently, which pushes it down. The net effect depends on which dimension of fatigue dominates. I have found that defensive fatigue is slightly more impactful than offensive fatigue, producing a modest over lean (about one point) in back-to-back games. The margin is thin, and I only use it as a tiebreaker when the advanced stats projection is sitting right on the bookmaker’s line.
The real discipline in totals betting is knowing when not to bet. My projection disagrees with the bookmaker’s line on roughly 60% of games. But only about 20% of those disagreements are large enough — three or more points — to represent genuine value after accounting for the model’s margin of error. The other 40% are noise. Betting those marginal spots dilutes your edge and increases variance without improving your long-term return. Pass on the close calls and wait for the clear separations.
How accurate are pace-based total projections for NBA games?
A well-constructed pace-and-efficiency model produces projections that land within four to five points of the actual game total approximately 70% of the time. That precision is not enough to profit on every game, but it reliably identifies the 15% to 20% of games where the bookmaker’s line diverges from the projection by three or more points — which is where the edge sits.
Should I bet the over or under when two fast-paced teams meet?
Not automatically the over. Two fast-paced teams will generate more possessions, but the bookmaker has already priced that into the total. The question is whether the total accurately reflects the combined pace and efficiency. If two up-tempo teams both play average defence, the over has value. If one plays elite defence despite a fast pace, the posted total may already overshoot the likely score.
Created by the ”bet Tips nba” editorial team.