NBA Expected Value Betting Calculations 2026
 Available in US
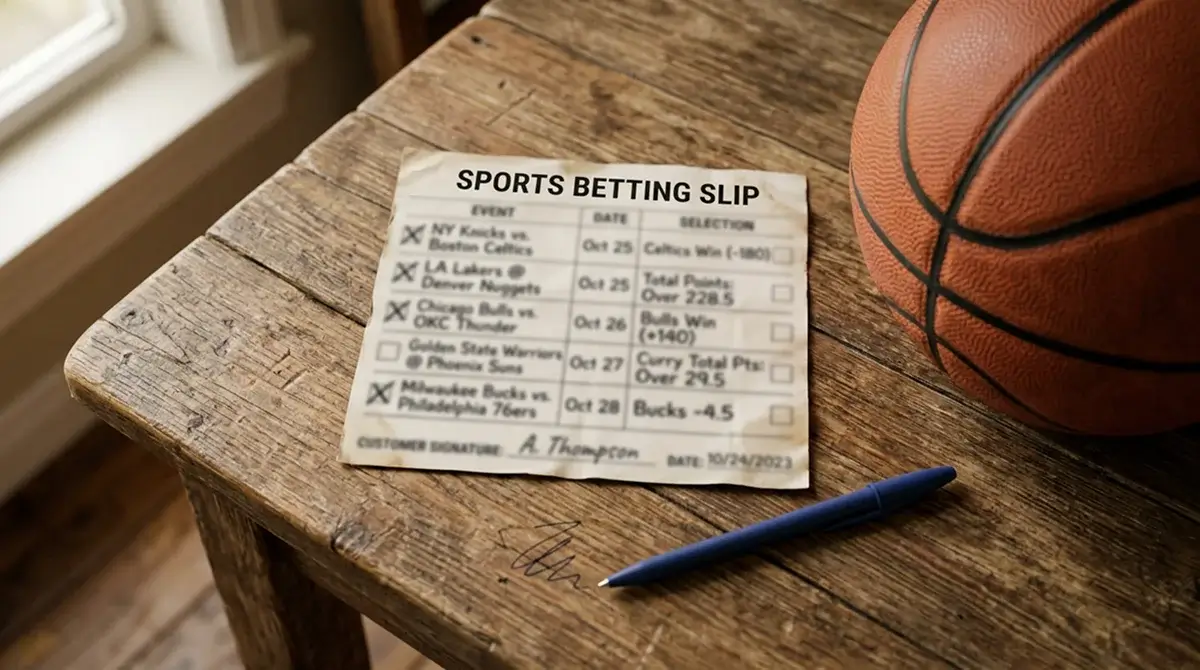
I remember the exact bet that changed how I think about NBA wagering. It was a Milwaukee Bucks spread play at -4.5, odds of 1.91. I liked the Bucks. I had done the work — checked the matchup, reviewed the schedule, compared my projection against the market. The Bucks lost by one. My bet technically lost too. But two weeks later, when I ran the numbers on that sequence of plays, I discovered something that reshaped my entire approach: the bets I was placing had positive expected value even when individual results went against me.
Expected value — EV — is the average profit or loss you can expect per bet if you placed it an infinite number of times. It is the lens that separates professional bettors from recreational ones. A recreational bettor asks, “Will this bet win?” A professional asks, “Is this bet profitable in the long run?” Those are fundamentally different questions, and EV is the tool that answers the second one.
The global sports betting market sits at roughly 125 billion dollars in 2026, projected to reach over 325 billion by 2035. Across all of that volume, the single thread connecting every successful bettor is expected value. It does not matter whether you bet NBA spreads, player props, or futures — if your bets carry positive EV consistently, the results take care of themselves over time.
Understanding the NBA Expected Value Formula
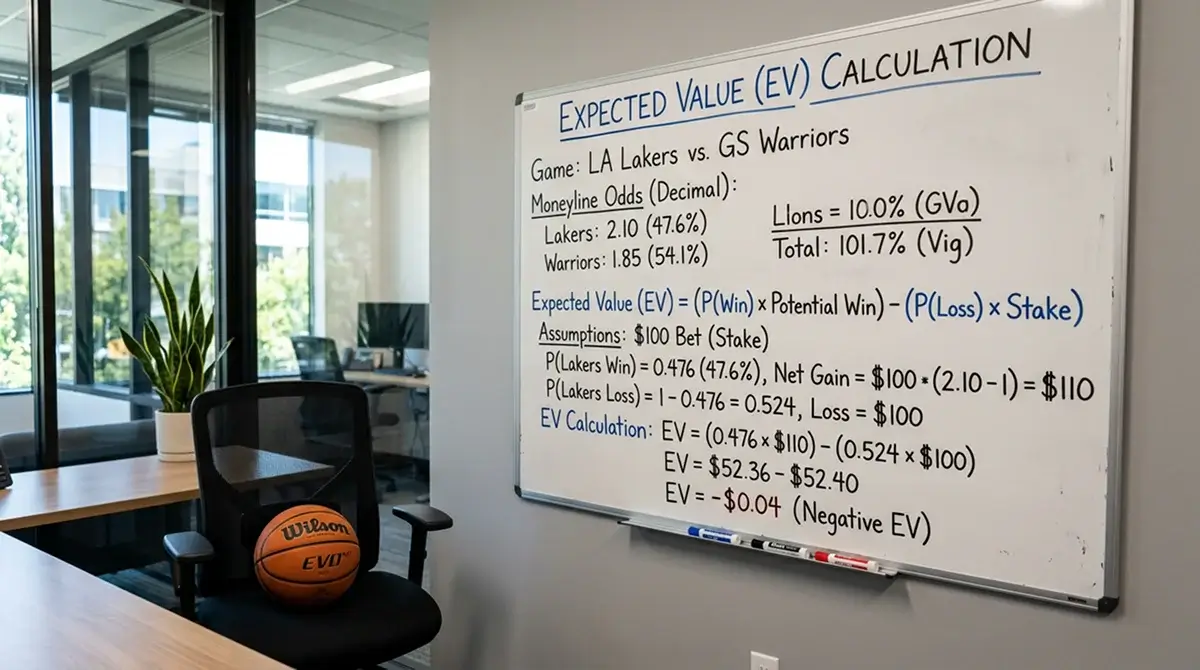
Strip away the maths anxiety and the formula is remarkably intuitive. Expected value equals the probability of winning multiplied by the profit if you win, minus the probability of losing multiplied by the amount you lose. Written out: EV = (win probability times net profit) minus (loss probability times stake).
Let me make that concrete. You bet ten pounds on the Celtics at decimal odds of 2.10. You estimate Boston’s true probability of winning at 55%. If they win, your net profit is 11 pounds (2.10 times 10 minus 10). If they lose, you lose your ten-pound stake. So: EV = (0.55 times 11) minus (0.45 times 10) = 6.05 minus 4.50 = +1.55. That means for every ten pounds you stake in this situation, you expect to profit 1.55 pounds on average. This is a positive-EV bet.
Now change one variable. Same odds (2.10), but you estimate the true probability at 45% instead of 55%. EV = (0.45 times 11) minus (0.55 times 10) = 4.95 minus 5.50 = -0.55. Negative EV. You expect to lose 55 pence per ten-pound bet over time. The odds are identical in both examples. The only difference is your assessment of probability — which is why improving your probability estimates is the entire game.
One conceptual trap to avoid: EV does not predict individual outcomes. A positive-EV bet loses regularly. A 55% win rate means 45% of your bets are losers. The value exists in the aggregate, over hundreds of bets. If you cannot stomach watching positive-EV bets lose without questioning your process, EV-based betting will feel terrible for the first three months. It feels great in month twelve, when the curve smooths and the results align with the maths.
Converting Decimal Odds to Implied Probability
Before you can calculate EV, you need to know the implied probability embedded in the odds — the break-even win rate the bookmaker’s price suggests. The conversion from decimal odds is a single division: implied probability equals one divided by the decimal odds.
At odds of 1.91: implied probability = 1 / 1.91 = 0.5236, or 52.36%. At odds of 2.50: 1 / 2.50 = 0.40, or 40%. At odds of 1.50: 1 / 1.50 = 0.6667, or 66.67%. These percentages tell you what the bookmaker’s model thinks the probability is — or more precisely, what probability would make the bet break-even after the vig.
Basketball accounts for somewhere between 15% and 18% of global betting turnover, and every one of those billions in wagers is priced using this same implied-probability framework. The bookmaker’s implied probability always sums to more than 100% across the two sides of a market — the overround. On a standard NBA spread, the two sides might imply 52.4% and 52.4%, totalling 104.8%. That extra 4.8% is the bookmaker’s margin.
Your edge lives in the gap between the bookmaker’s implied probability and your own estimate of the true probability. If the implied probability is 52.4% and you estimate the true probability at 57%, you have roughly a 4.6% edge. That edge, applied consistently through disciplined staking, is what generates long-term profit.
Where Positive EV Hides in NBA Markets
Not all NBA markets are priced equally. The main spread and main total on a high-profile game — Lakers versus Celtics on a Saturday night — attract the most volume, the most sharp action, and the tightest pricing. Finding positive EV in those markets requires a better model than the bookmaker’s, which is a high bar.
Softer pricing lives in the margins. Player props, particularly for role players who do not attract heavy betting volume, are priced with wider overrounds and less model sophistication. A starter’s points over/under might be razor-sharp, but the backup centre’s rebounds line — set by a less granular model and barely touched by sharp money — can be off by a full rebound.
Game-specific situations also create EV pockets. Teams on the second night of a back-to-back, teams playing their fourth road game in six nights, teams with a key player returning from a three-game absence — these scenarios bend the true probability in ways that the bookmaker’s model captures imperfectly. My own tracking data over three seasons shows that schedule-based situational plays carry an average EV of +2.1% per bet, compared to +0.8% for my model-driven spread plays. The situations are not always available, but when they are, they pay.
One more pocket that I lean on: early lines. NBA lines typically open 18 to 24 hours before tip-off, and the opening number is the bookmaker’s least confident price. The strategic bettor who acts on a well-researched opinion before the market sharpens the line captures the most favourable odds. By tip-off, the line has absorbed thousands of bets, sharp and public alike, and the EV window narrows — sometimes to zero. Being early is not a guarantee of positive EV, but it is a structural advantage that costs nothing to exploit.
Can I calculate expected value without building a model?
Yes. You do not need a formal statistical model to estimate probabilities. A structured approach using team records, recent form, schedule context, and key absences can produce probability estimates good enough for EV calculation. The goal is not perfect precision — it is being more accurate than the bookmaker’s implied probability often enough to generate an edge.
What is a good positive-EV threshold for placing an NBA bet?
Most experienced bettors set a minimum of +2% to +3% EV before placing a bet. Below that, the edge is too thin to survive the margin of error in your probability estimates. At +5% or above, the bet is compelling regardless of confidence level. The threshold depends on your sample size and risk tolerance, but +3% is a sensible starting floor.
Published by the bet Tips nba team.